Debug Microservices with OpenTelemetry and Prometheus
This course includes
- 6 lessons across 3 modules
- Hands-on coding exercises
- Downloadable resources & code
- Full GitHub repository access
- Certificate of completion
- 12 months of access
Why This Course?
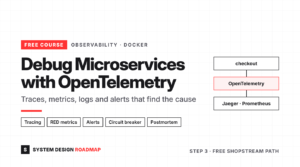
When ShopStream's checkout gets slow or starts failing, the cause is usually in another service: a slow payments call, a leaked database connection, a retry storm. Without telemetry you grep three log files and guess. This course breaks ShopStream on purpose — a 300 ms slowdown, a 1% error background, a connection-pool leak, a memory leak, a hung dependency, a bad deploy — and shows you how to find each cause in minutes with traces, metrics and logs, and how to measure what each fix buys.
What You'll Build
Three Python services (checkout, inventory, payments) instrumented with OpenTelemetry, exporting traces to Jaeger, RED metrics to Prometheus and trace-aware JSON logs; Grafana dashboards; alert rules for symptoms and causes; a trace analysis that finds the slow service by self time; a circuit breaker with jittered retries; and an incident runner that writes a postmortem from the telemetry. Every lesson ends with a demo that prints real numbers and a verify script that gives you a completion code.
Who Should Take This Course?
Backend engineers who run or are about to run microservices and want to debug them with evidence instead of guesses.
On-call engineers who want alerts worth waking up for and a repeatable way to write postmortems.
Engineers preparing for system design interviews who need to explain observability, cascading failures and circuit breakers with numbers.
Anyone who finished the Kafka course (step 2 of the free path) and wants to see inside their services.
What Makes This Course Different?
Every lesson injects a real fault and measures it. You don't just add a circuit breaker; you watch a hung payments service take browsing down to 76% success, make it worse (41%) with naive retries, and then hold it at 100% with a 75 ms p99. Everything runs with one command in Docker: no cloud account and no language toolchain to install.
What's Included
Repository
Run it on your machine (Linux, macOS or WSL; needs Python 3.10+ and Redis):
git clone https://github.com/sysdr/shopstream-opentelemetry-debugging.git
cd shopstream-opentelemetry-debugging
bash test_all.sh  # runs all lessons, or: cd lessons/lesson-1 && bash start.sh
In the sandbox, run: cd lessons/lesson-1 && bash start.sh
Prerequisites
Comfortable in a terminal; basic HTTP and JSON.
Reading simple Python helps (the services are small Flask apps), but you don't need to install Python.
Docker Desktop, or Docker Engine with the Compose plugin, and about 2 GB of free memory.
This course includes
- 6 lessons across 3 modules
- Hands-on coding exercises
- Downloadable resources & code
- Full GitHub repository access
- Certificate of completion
- 12 months of access